

AI can produce presentation-quality slides reliably when it comes to layout, design, and structure, but factual and numeric claims still need a human check before you present. If you only have time for one thing, extract every claim on every slide and confirm it against its original source. That single habit catches the errors that layout quality tends to hide.
TL;DR:
- Confirm every factual statement against its original source to avoid errors masked by the slide's polish, focusing on specific claims and references.
- Check that data visualizations match the underlying data, verify figures for units and periods, and ensure citations accurately reflect the cited source's content.
- Be aware that hallucinations often occur in invented numbers, misattributed sources, mismatched charts, and overly polished formatting that conceals weak content.
- Use a detailed, claim-by-claim verification checklist with source mapping, numeric cross-checks, and triage steps to enable fast, reliable slide reviews.
- Attach verified, native data sources and use structured evaluation features to embed verification into your usual deck creation workflow, reducing post-production errors.
Table of Contents
- What does accuracy actually mean for a slide?
- Where AI-generated slides most often invent or distort content
- How your input choice changes the accuracy risk
- A step-by-step verification checklist for every deck
- Which tool features and evaluation practices actually reduce errors
- Building verification into a real presentation workflow
- Trust but verify: setting your own threshold
- How Quikturn supports an accuracy-first workflow
- FAQ
- Sources
What does accuracy actually mean for a slide?
"Accuracy" is not one thing on a slide, and treating it as a single score hides where the real risk sits. A deck can look flawless and still carry a wrong number, a fabricated source, or a chart that plots the wrong column.
Four distinct checks matter, and each needs its own test:
- Factual accuracy: can you point to the exact sentence in a source document that supports the claim on the slide?
- Numeric accuracy: does the figure match the original dataset or document, including units, time period, and rounding?
- Visual and data alignment: does the chart or table on the slide plot the same values and labels as the underlying data?
- Source fidelity: does the cited source actually say what the slide attributes to it, and does the citation point to a real, findable document?
A deck can fail one of these while passing the other three. A revenue chart can use the correct dataset but mislabel the axis. A bullet point can cite a real report but misstate its conclusion. Research separating slide evaluation into distinct dimensions, including content fidelity, visual quality, and editability, has found that models can score well on one axis while falling short on another. This is why a single blended accuracy number tends to mask the specific failure a reviewer needs to find, according to SlidesGen-Bench. Treating accuracy as four separate questions, rather than one, is what makes a review fast and repeatable.
Where AI-generated slides most often invent or distort content
Hallucinations in slide generation tend to cluster in a few predictable places, and knowing them lets you focus your review where it counts instead of re-checking an entire deck line by line.
- Invented numeric claims: market sizes, growth rates, and percentages that sound plausible but trace to no real source.
- Misattributed citations: a real-sounding source name attached to a claim the source never made.
- Charts with mismatched data: visuals that look correctly formatted but plot the wrong column, period, or category.
- Polished formatting masking thin content: clean typography and layout that make an unverified claim look authoritative.
Research testing presentation models across varied input settings found that visually plausible decks can still fail on claim-to-evidence alignment, particularly when a deck pulls from multiple source documents, according to UniPPTBench. Visual polish has outpaced grounding, which is exactly why a good-looking slide deserves more scrutiny, not less.
Pro Tip: Treat any slide with a specific number and no visible source note as unverified until you check it, regardless of how clean the formatting looks.
How your input choice changes the accuracy risk
The way you prompt or feed an AI tool changes how much verification you need afterward, and the difference is large enough to plan around.
- Source-grounded workflows: attaching the actual passages, reports, or datasets you want summarized and requiring inline citations produces the highest factual fidelity, because the model has less room to invent.
- Outline-driven workflows: giving a structured outline with specific data points and section goals balances speed with accuracy, though numbers still need a spot-check.
- Free-prompt or demo workflows: asking for a deck on a topic with no attached source material is fastest but carries the highest risk, since every claim is a candidate for fabrication.
- Practical input habits: attach the primary document, name the exact figures you want extracted, and ask the tool to flag any number it cannot source rather than guessing.
A classroom study comparing AI-generated and human-made lecture slides found that viewers could not reliably tell them apart on perceived quality, yet the AI outputs still contained minor factual or formatting errors that required instructor correction before use, according to research on GenAI-generated lecture slides. The lesson carries directly into professional settings: polish is not evidence of accuracy, and the input you provide is the strongest lever you have over the output's reliability.
A step-by-step verification checklist for every deck
A short, repeatable procedure turns slide review from a vague worry into a concrete task with a defined endpoint.
- Step 1, claim inventory: list every factual or numeric statement on every slide in a single sheet, one row per claim.
- Step 2, source mapping: for each claim, record the exact document, page, or dataset cell that supports it, or mark it "unsourced."
- Step 3, numeric check: recalculate or cross-check every number against its source, confirming units, time period, and rounding.
- Step 4, visual alignment check: confirm each chart plots the correct columns, labels, and date ranges from the underlying data.
- Step 5, triage: sort every claim into fix (wrong or unsourced), flag (uncertain, needs a second reviewer), or accept (verified).
A benchmark built specifically for slide evaluation uses an average of 54 checklist-style binary checks per deck, and finds this atomic approach aligns more closely with human judgment than a single holistic score, according to PresentBench. That level of granularity is more than most teams need for a routine deck, but the principle scales down cleanly: a handful of binary, item-level checks per slide beats one subjective "does this look right" pass.
The triage step is what makes this workflow sustainable. A claim that fails the fix or flag test does not get presented until it passes, and a claim that clears all four checks moves forward with no further debate.
Which tool features and evaluation practices actually reduce errors
Not every AI presentation tool is built the same way underneath, and the architectural choices behind a tool determine how much manual verification you will need afterward.
- Retrieval-augmented generation (RAG) and source citation pipelines: tools that pull from a defined document or database and cite the specific passage used give you a starting point for verification instead of a blank search.
- Automated probes and audit trails: structured evaluation that maps each claim to its supporting document and records a pass, fail, or partial verdict creates a reviewable trail instead of a single confidence score.
- Checklist-based atomic verification over holistic scoring: item-level binary checks catch specific failures that a single quality rating tends to miss.
- Deployment testing: red-teaming, small-scale user testing, and field validation before rollout catch real-use failures that a demo environment does not surface.
NIST's evaluation guidance for agentic systems recommends building integrated evaluation probes and structured audit trails that map claims to supporting documents and verdicts, moving evaluation past "the AI said so" and toward evidence a reviewer can actually check.
Evaluation guidance from NIST's work on agentic AI recommends combining model testing, red-teaming, and user testing while producing a structured audit trail of claims and verdicts, rather than relying on a model's own confidence signal. For teams evaluating SEC filing analysis tools, a similar audit-ready approach is described in Filingsiq, where the same claim-to-source mapping principle applies to financial disclosures. When you are comparing presentation tools, ask directly whether the tool can show you the source behind a given claim, not just the claim itself.
Building verification into a real presentation workflow
A verification checklist works best when it is attached to a specific stage of deck production rather than treated as a separate audit at the end. In a workflow built on a verified data asset, such as a logo and company-intelligence database covering more than 17 million verified entries, the ground-truth layer of a slide (company names, tickers, domains) starts from a source that does not need independent fact-checking the way a generated market claim does.
- Verified reference data: company names, logos, and identifiers pulled from a checked database remove one entire category of claim from your verification list.
- Editable, native output: exporting slides as native PowerPoint files, rather than flattened images, means a reviewer can trace a chart back to its underlying data and correct it directly, as our platform's export options support.
- Insertion points for the checklist: run the claim inventory step after the first draft is generated and before any client-facing export, so corrections happen once instead of across multiple versions.
- Integration into existing tools: working through a PowerPoint add-in keeps the verification step inside the same file the final audience will see, instead of a separate review document that can drift out of sync.
Agentic and API-based workflows can also route verification through an MCP server integration, letting an automated check run before a slide reaches a human reviewer.
Trust but verify: setting your own threshold

Not every slide needs the same level of scrutiny. Internal brainstorming decks can accept AI output as-is, since the stakes of an error are low and the audience can ask questions directly. Client-facing, investor-facing, or audited materials need the full claim-by-claim check described above, with no exceptions for numbers or citations.
A simple rule: match verification depth to audience size and stakes. A deck seen by one internal team needs a light pass. A deck seen by a client, a regulator, or a committee needs every claim mapped to a source before it leaves your hands. Assign one person as the final sign-off on claim accuracy, even on a team deck, so the check does not quietly skip a review cycle.
— Quikturn Team
How Quikturn supports an accuracy-first workflow
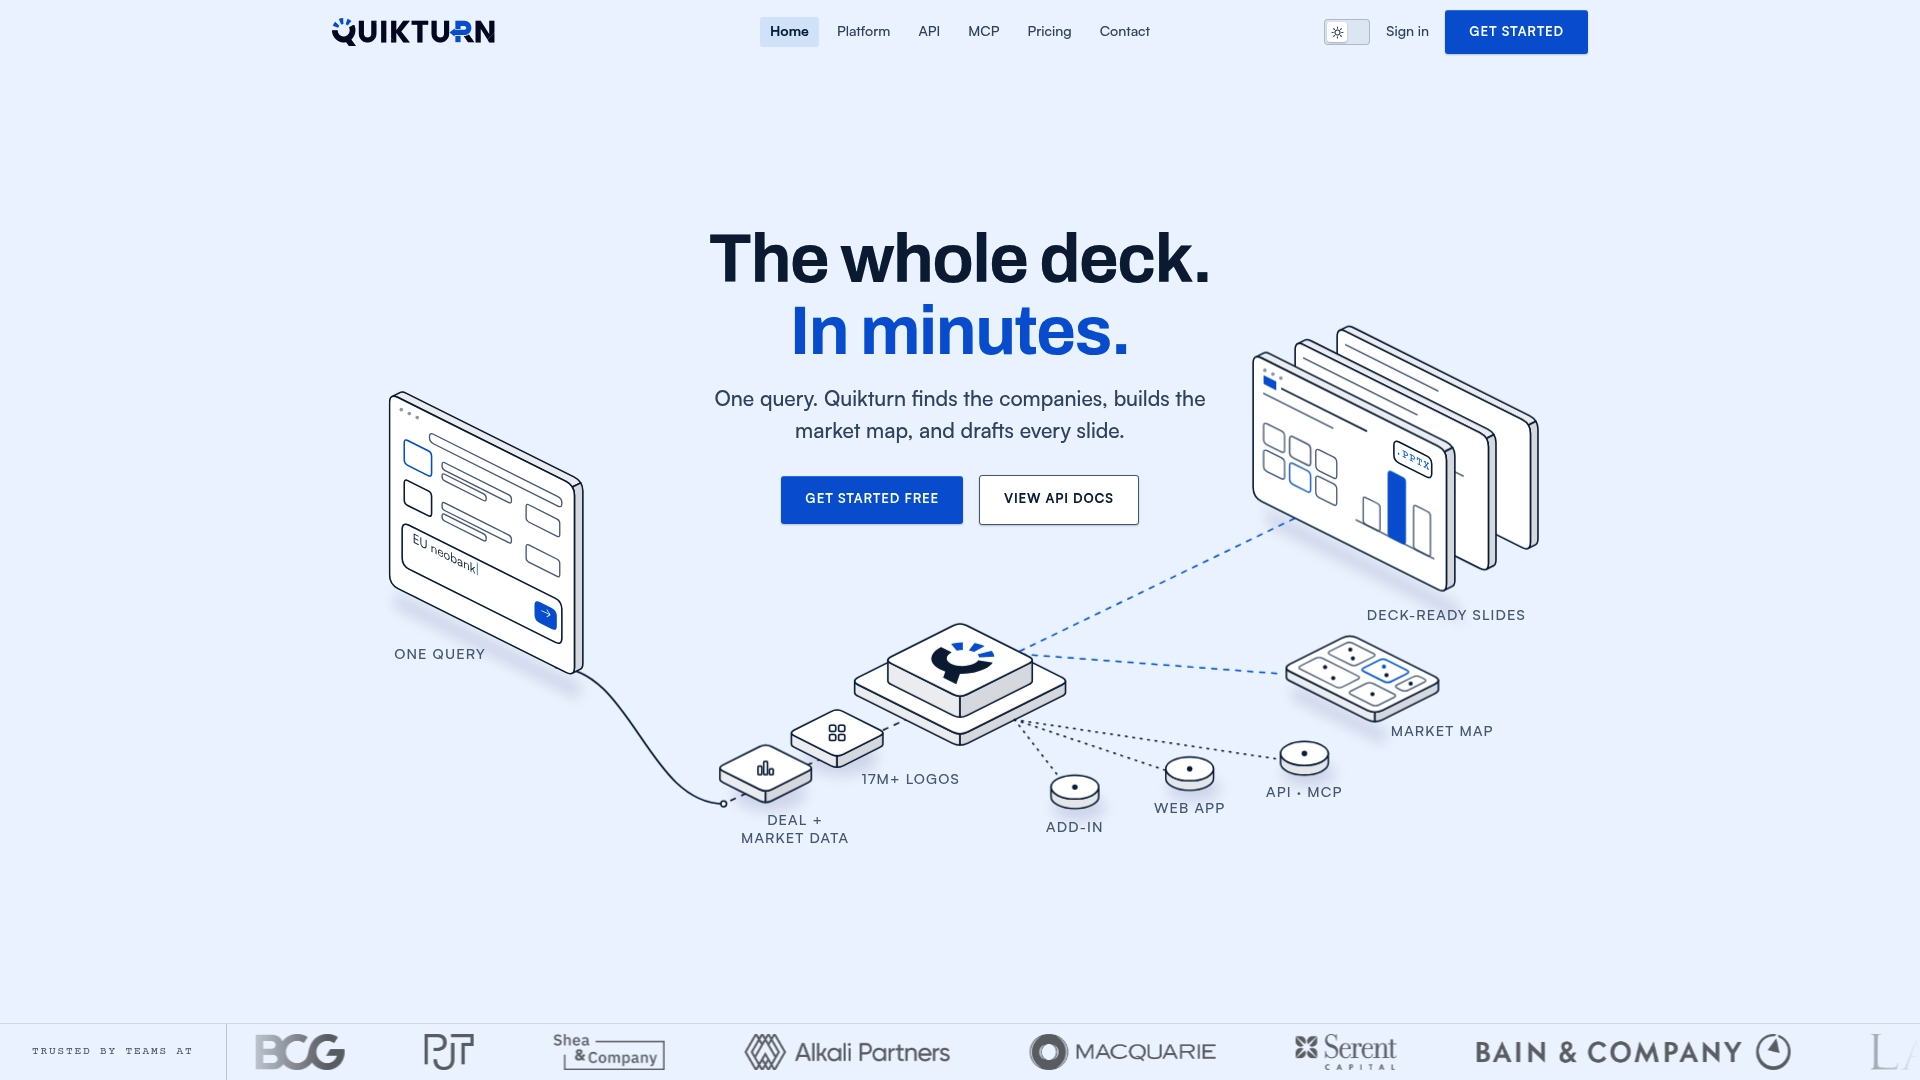
Verification works best when it starts from clean inputs instead of a blank prompt. Our platform pulls company names, logos, tickers, and domains from a verified database of more than 17 million entries, so the reference data on your slides does not need the same fact-checking as a generated statistic. Decks export as native, editable PowerPoint files, which means a reviewer can trace a chart back to its source and fix it directly rather than regenerating the whole slide.
- Verified company data: logos, tickers, and domains pulled from a checked database rather than generated from scratch.
- Editable exports: native PowerPoint output that keeps charts and data traceable after generation.
- Workflow integrations: web app, PowerPoint add-in, and API access fit into existing review cycles.
| Plan | Best for |
|---|---|
| Platform Free | Testing the workflow before committing |
| Platform Pro | Individual analysts running regular deck work |
| API Launch | Teams building verified data into their own tools |
Start on the free tier or review full plan details on our pricing page, or head to Get Started to set up your first verified deck.
FAQ
What is the 30% rule for AI?
If you have seen this phrase attached to a particular framework or vendor, it is worth checking that source directly, since definitions of informal rules like this vary and are not standardized across the field.
Can you tell if slides are AI generated?
A classroom study comparing AI-generated and human-made lecture slides found no significant difference in perceived quality, meaning viewers generally could not identify AI-made slides by appearance alone, according to research on GenAI-generated lecture slides. The more reliable giveaway is content, not design: unsourced numbers, mismatched chart data, or citations that do not hold up under a quick check.
What is the 7x7 rule for presentations?
The 7x7 rule is a long-standing slide design guideline suggesting limited lines of text and words per line to keep slides readable and prevent text overload. It addresses visual design and readability, not factual or numeric accuracy, so following it does not reduce the need to verify claims separately.
What is the 10/20/70 rule for AI?
This is not a standardized or widely sourced rule in AI slide generation or AI evaluation research, and no established framework defines it with consistent numbers. If you encountered it tied to a specific tool or author, treat it as that source's own framing rather than an industry standard.
How do I quickly check if an AI-generated chart is accurate?
Compare the chart's labels, time period, and plotted values directly against the original dataset or document it claims to summarize, rather than judging it by how clean it looks. Benchmarking research has found that visually polished decks can still plot the wrong values or mismatch labels, especially when a deck draws from multiple source documents, according to UniPPTBench.
Sources
- SlidesGen-Bench: Evaluating Slides Generation via Computational and Quantitative Metrics
- Building evaluation probes into agentic AI | NIST