

The fastest path to a polished, editable PowerPoint from a CSV file is an AI-powered conversion workflow that exports native .pptx, not a flattened image dump. A clean spreadsheet feeds in, and a working deck with editable charts, formatted slide text, and speaker notes comes out in minutes. The catch: your CSV needs consistent headers and clean data types first, and you should confirm how the tool handles your data before uploading anything sensitive.
TL;DR:
- CSV files should have consistent headers and data types to ensure the conversion tool generates accurate and editable PowerPoint decks.
- Most automated tools convert 200 to 2,000 rows into a 10 to 15 slide presentation in under a few minutes, saving hours of manual work.
- Native .pptx exports that preserve editable charts and text are essential; otherwise, charts become static images that cannot be adjusted inside PowerPoint.
- Uploads are safest when data is processed locally or with strict enterprise controls, especially for sensitive or regulated information.
- Auto-generated decks work well for recurring, data-heavy reports but are less suitable for presentations where narrative and storytelling carry more weight.
Table of Contents
- Where Automated CSV to PowerPoint Generation Actually Saves Time
- How Does a CSV Get Turned Into a PowerPoint Automatically?
- Preparing Your CSV for the Best Results
- What Exports Look Like and Whether They Stay Editable
- Data Handling and Enterprise Controls Worth Checking
- How Quikturn Turns Your CSV Into a Deck Ready for Review
- When Automation Is Enough, and When It Isn't
- Sources
- FAQ
Where Automated CSV to PowerPoint Generation Actually Saves Time
Not every reporting job needs automation, but the ones that repeat every week or month are where it pays off fastest. If you're rebuilding the same deck structure with fresh numbers each cycle, you're paying a repetitive tax that automated CSV to PowerPoint conversion eliminates almost entirely.
The clearest wins show up in a handful of recurring formats:
- Finance teams running monthly P&L reviews, revenue trend decks, or investor updates where the slide structure barely changes but the numbers do every cycle.
- Marketing teams turning campaign exports into channel performance recaps, complete with ROAS breakdowns and spend-versus-return charts.
- Product and operations teams building metrics dashboards or release reports pulled straight from analytics exports.
- Consultants and analysts who need a one-off research deck fast and don't want to spend an afternoon formatting charts by hand.
A typical structured CSV with 200 to 2,000 rows across five to ten columns usually converts into a 10 to 15 slide deck in a few minutes rather than the two to four hours it might take to build manually with chart formatting, titles, and speaker notes. The time saved compounds fast if you're producing the same report every month.
How Does a CSV Get Turned Into a PowerPoint Automatically?
The pipeline behind most modern csv to powerpoint tools follows a consistent sequence, and understanding each step helps you know where to double-check the output before it goes to a client or your CFO.
- Upload. Most tools accept .csv, .xlsx, and .xls directly, often with drag-and-drop and an instant preview of the first several rows.
- Parse and detect schema. The engine reads column headers and infers which fields are dimensions (categories, dates, company names) versus metrics (revenue, units, percentages).
- Extract KPIs automatically. Numeric columns get scanned for totals, growth rates, and outliers, and the tool proposes chart types based on the shape of the data. A time series column pairs with a line chart; category breakdowns typically become bar or pie charts.
- Apply slide templates. Titles, chart placement, and color themes get generated automatically, often syncing to a brand template if one is configured.
- Export. The finished deck downloads as a .pptx file, ideally with charts still backed by an editable data table rather than a static image.
Generation time for a standard 10 to 15 slide deck from a clean CSV typically runs from under a minute to a few minutes, depending on row count and chart complexity. Developer-built pipelines follow the same logic in code. Open-source projects like pptx_autogen expose a function that takes a CSV, a company name, and a subtitle, and returns a finished .pptx file, which shows the pattern holds whether you're clicking a button or calling an API.
Pro Tip: Before you trust an auto-generated chart, click into it. If PowerPoint opens a chart data table you can edit, the export is native. If it just lets you resize a picture, you've got an image, not a chart.

Preparing Your CSV for the Best Results
The quality of the output depends almost entirely on the quality of the input. A messy CSV produces a messy deck no matter how good the conversion engine is.
- Use a single header row with clear, descriptive column names. Merged or multi-row headers confuse schema detection almost every time.
- Keep one data type per column. A "Revenue" column mixing "$45,000" and "45000" will break numeric parsing.
- Use consistent, ISO-style dates (YYYY-MM-DD) rather than mixing "3/4/25" and "March 4, 2025" in the same file.
- Strip out subtotal rows, grand totals, and blank rows before uploading. These get misread as data points and skew charts.
- Normalize currency symbols and units across the whole column rather than switching mid-sheet.
- For very wide tables (30+ columns), pre-aggregate down to the metrics that actually belong on a slide rather than dumping everything and hoping the tool picks well.
Run a quick sanity check before you upload: preview the first 20 rows and imagine the chart that should come out of them. If that's not obvious to you, it won't be obvious to the algorithm either.
What Exports Look Like and Whether They Stay Editable
This is the detail that separates a genuinely useful tool from one that just makes pretty screenshots. A native .pptx export preserves editable charts and text boxes you can restyle, resize, and re-source directly inside PowerPoint. A flattened export just embeds an image of a chart, which looks fine until someone asks you to change the color scheme or update one number.
A few things to check before you commit to a tool:
- Open a generated chart and look for a "Edit Data in Excel" or similar option. If it's there, you've got a real chart object.
- Text on slides should be selectable and editable, not baked into a picture.
- Confirm the tool respects your slide master or brand template rather than overriding fonts and colors on export.
- Watch for tools that silently rasterize complex charts (like combo charts or stacked area charts) into images because they couldn't render them natively.
Community tools like pptx-bulk-edit demonstrate the alternative pattern: populating existing PowerPoint placeholders from CSV rows, which keeps your brand template fully intact because you're filling in a deck you already built rather than generating one from scratch.
Data Handling and Enterprise Controls Worth Checking
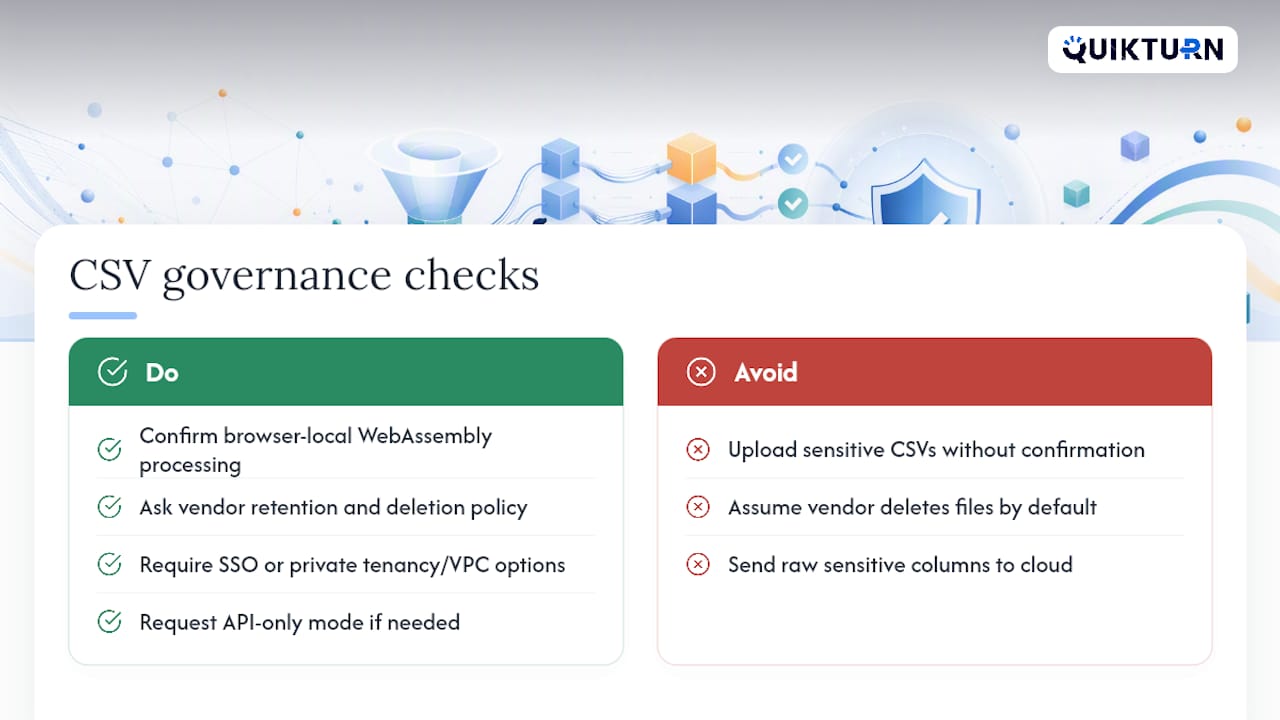
Before uploading a CSV full of client revenue or deal data, know where that file goes. Some tools process everything in the browser using WebAssembly, meaning your data never leaves your machine. Others send it to a cloud server for parsing, which is fine for most use cases but worth confirming against your compliance policy.
Ask specifically about retention: does the vendor delete uploaded files after processing, or keep them for a set window? For regulated teams, look for single sign-on, private tenancy or VPC deployment options, and API-only modes that skip the web UI entirely. If none of that's confirmed, sanitize sensitive columns or route the file through an internal ETL step first.
How Quikturn Turns Your CSV Into a Deck Ready for Review
Some AI-powered platforms are built to address the problem of creating data-heavy decks quickly, while preserving the ability to edit numbers after the fact. Users can query large databases of company logos and market intelligence records to draft slides, market maps, and company detail pages in seconds, instead of spending hours manually locating logos and formatting charts.

The workflow adapts to how your team already works. Use the web app for quick one-off decks, the PowerPoint add-in for editing directly inside a deck you're already building, or the REST API for teams that want to wire CSV to PowerPoint conversion straight into an internal reporting pipeline. Enterprise teams get dedicated security controls and deployment options through Quikturn's enterprise solutions, which matters if you're handling deal data or client financials that can't sit on just any server.
If you're evaluating this against a PowerPoint add-in you already use, the comparison against UpSlide breaks down where the two diverge on speed and data coverage. Ready to see it on your own data? Get started with Quikturn and run your first CSV through it today.
When Automation Is Enough, and When It Isn't
Automation wins for anything repeatable and data-heavy: the monthly KPI deck, the recurring investor update, the campaign recap nobody enjoys building by hand. It falls short on decks that live or die on narrative, where the story matters more than the chart.
Our advice: auto-generate the full draft, then spend your saved hours on the three or four slides an investor or client will actually scrutinize. That's a better use of an analyst's time than manually formatting a bar chart at midnight.
— Quikturn Team
Sources
For teams building their own conversion logic, pptx_autogen and the Aspose.Cells API reference offer working code and documented conversion methods worth studying before you build from scratch.
FAQ
How Do I Automatically Generate a PowerPoint From Excel?
Upload your Excel file to an AI-powered conversion tool that detects columns, extracts KPIs, and builds slides with charts automatically. Most tools that generate PowerPoint from CSV also accept .xlsx and .xls directly, so no manual export step is needed.
Can You Auto-Populate a PowerPoint From Excel?
Yes. Tools like pptx-bulk-edit map spreadsheet rows directly into existing slide placeholders, and AI-driven platforms like Quikturn can populate a fresh deck from your data without a pre-built template.
Can AI Convert Excel to PowerPoint?
AI-powered platforms can parse Excel data, infer chart types, extract key metrics, and generate a formatted, editable PowerPoint deck in minutes. The output quality depends heavily on how clean and consistent the source spreadsheet is.
How Can I Convert Excel Data Into PowerPoint Charts That Stay Editable?
Choose a tool that exports native .pptx files rather than image-based slides, then verify by clicking a chart and confirming PowerPoint opens an editable data table instead of a static picture.
What Should I Clean Up in a CSV Before Converting It to Slides?
Use single-row headers, consistent data types per column, ISO-style dates, and remove blank rows or totals that could get misread as data points during conversion.