
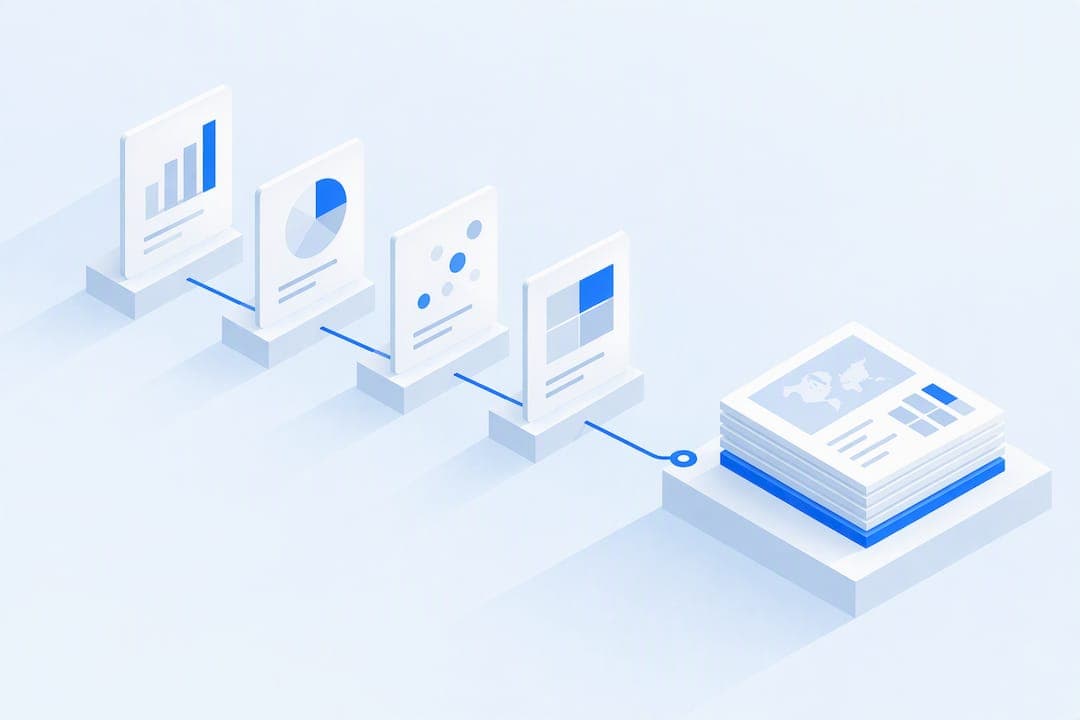
Private equity reporting automation means generating investor decks, market maps, and company slides from a verified database of logos and company data instead of building them by hand. The payoff is speed: a market map or comps slide that once took an analyst hour comes together in minutes, with fewer broken logos and stale company names. Tools like Quikturn deliver this through a web app, a PowerPoint add-in, and an API, so the workflow fits however a deal team already works.
TL;DR:
- Automation dramatically reduces the time to create market maps and comparable slides, dropping a typical project from hours to minutes.
- Using verified logo and company data helps prevent errors that can undermine client trust and ensures consistency across decks.
- Pilot programs should focus narrowly on one deliverable type and a single live deal to accurately gauge time savings and error reduction.
- Integration features such as APIs, SDKs, and AI agents are paving the way for more seamless, embedded reporting workflows.
- Proper governance, clear success metrics, and security practices are essential for a safe and effective rollout of automation tools.
Table of Contents
- What automation actually produces: deliverables and data behind them
- How much time and consistency does automation actually buy you
- Step-by-step workflows deal teams can copy this week
- How to pilot and roll out reporting automation safely
- What to test before you commit to a reporting tool
- Compliance considerations specific to private equity reporting
- Where reporting automation in private equity is headed
- What we have learned from early automation pilots
- Getting started with Quikturn for your next pilot
- FAQ
What automation actually produces: deliverables and data behind them
Deal teams rarely need one slide. They need a cover slide, a market map, a comps table, individual company profile cards, and a logo wall, all pulling from the same underlying facts so nothing contradicts itself across the deck. Each of those deliverables depends on a handful of data fields that have to be right every time: company name, domain, ticker (where applicable), logo, a short descriptor, a sector tag, and sometimes a revenue band for sizing comparisons.
- Cover and divider slides pull company name, logo, and sector tag for quick visual framing.
- Market maps group dozens of companies by sector tag and descriptor into a single visual grid.
- Comps slides line up tickers, revenue bands, and descriptors for side-by-side comparison.
- Company profile cards combine logo, domain, and descriptor into a one-page summary.
- Logo walls showcase verified logos across a portfolio or sector without manual image hunting.
A verified logo database matters here because a single mislabeled or outdated logo in a client-facing deck is the kind of error that undermines an otherwise sharp analysis. Quikturn draws from a very large database of company logos and company metadata, and the same query results flow into the web platform, the PowerPoint add-in, or an API call, so the data stays consistent regardless of which interface an analyst reaches for.
How much time and consistency does automation actually buy you
The clearest case for automation shows up in the gap between updating one slide and refreshing an entire deck. Swapping a single company's logo and descriptor by hand takes a few minutes of searching, downloading, and resizing. Refreshing a 40-company market map the same way can eat an entire afternoon, and that is before anyone checks for outdated branding or a misspelled ticker.
Automation collapses both tasks into a query and an export. The gains show up in three places:
- Speed: a market map or comps slide generates in minutes instead of hours.
- Consistency: every logo and label comes from the same verified source, so decks across a team look uniform.
- Operational leverage: bulk exports and reusable templates mean the second deck for a similar deal takes a fraction of the time of the first.
On average, it takes about 4 hours to make 1 market map manually, according to Quikturn's blog on PowerPoint add-ins, a figure that puts the scale of manual slide work in perspective when a team is building several maps a week.
Worth tracking during a pilot: average time per deck, logo or data error rate, and how many decks get rebuilt from an existing template versus started from scratch. Those three numbers tell you more about real ROI than any vendor claim.
Step-by-step workflows deal teams can copy this week
Three workflows cover most of what an analyst needs in a given week, and each one maps cleanly to a specific tool inside the platform.
- Market-map generation: start with a list of target companies, enrich each entry with logo, domain, and sector tag, arrange the layout by sub-sector, then export to PowerPoint. An analyst can typically complete a 30 to 50 company map in under 30 minutes.
- Bulk comps or logo panel creation: feed a larger company list into bulk processing or the API, let the system match logos and metadata in batch, then drop the output into a comps template. This suits lists of 100 or more companies where manual lookup is not realistic.
- Single-deck refresh: use the PowerPoint add-in to swap outdated logos or company details directly inside an existing deck, with template formatting preserved so the deck does not need a full rebuild.
Each workflow has a natural owner: a junior analyst typically runs the market-map and comps workflows, while a deal lead or VP handles the final refresh pass before a deck goes out the door.
Pro Tip: Build one locked template per deliverable type (market map, comps, profile card) before your first pilot, so automation fills in data rather than fighting inconsistent formatting.
How to pilot and roll out reporting automation safely
A focused pilot beats a broad rollout. Before touching a single deck, define scope narrowly and set clear acceptance criteria.
- Define scope: pick one deliverable type (market maps work well) and one live deal or sector as the test case.
- Set success metrics up front: time per deck, error rate, and whether the output needs rework before it goes to a partner.
- Run a security checklist: confirm SSO support, role-based access, and whether presentation content is stored or discarded after export.
- Assign roles: one analyst builds, one senior reviewer signs off, one IT or compliance contact handles access provisioning.
- Run the pilot over two to four weeks: produce three to five real deliverables, not test files, so the comparison to manual work is honest.
- Review against acceptance criteria: did the deck meet quality bar without manual rebuild, and did it save measurable time.
- Roll out gradually: add naming and versioning conventions, a short training session for the next cohort of analysts, and a support contact for questions.
- Track ongoing KPIs: time per deck, error rate, adoption rate across the team, and turnaround time from request to finished slide.
A pilot that produces real deliverables for a live deal tells you far more than a sandbox test ever will, because the review process from analyst to partner is where most formatting friction actually surfaces.
What to test before you commit to a reporting tool
Vendor claims are easy to make and hard to verify, so the evaluation should focus on what you can actually check during a trial.
- Data coverage and freshness: ask how large the logo and company database is, how often it updates, and test a handful of obscure or recently rebranded companies.
- Integration behavior: check how the PowerPoint add-in handles existing templates, what export formats are available, and whether API responses are fast enough for batch jobs.
- Security posture: confirm SSO availability, role-based permissions, and whether the platform retains presentation content after a session or discards it, a detail Quikturn addresses directly through its enterprise solutions page.
- Commercial shape: compare monthly versus annual pricing, what a free tier actually allows, and whether support response times are defined anywhere.
Partner resources outside the vendor's own site are useful here too. Evibe's guide to automating portfolio reports lays out a practical pilot structure and KPI suggestions that apply just as well to deck automation as to portfolio tracking. For teams that need to verify how a vendor's integration actually behaves under the hood, Gyrence's documentation on audit trails and structured web-data extraction outlines the kind of traceability a compliance or IT reviewer should expect to see.
Compliance considerations specific to private equity reporting
Investor decks and portfolio summaries carry real compliance weight, even when the automation itself is just assembling slides. The core obligation stays the same whether a deck is built by hand or generated in minutes: every figure, descriptor, and comparison shown to an investor needs a clear, defensible source behind it.
Automation does not remove that responsibility, it just changes where it sits. A deal team still needs a named reviewer who signs off on a deck before it reaches an investor, regardless of how fast the draft came together. That review should specifically check that automated data pulls, like a revenue band or sector classification, match the firm's own diligence records rather than a third-party estimate that happens to look current.
Data handling is the other piece worth attention. Portfolio company information, including non-public financials used in a comps slide, should only pass through a platform that is explicit about what it stores and for how long. Enterprise-grade security features such as SSO and role-based access control matter less for convenience and more because they create an audit trail of who touched a deliverable and when, which is exactly the kind of record a compliance review or an LP due-diligence request might ask for.

None of this is a substitute for a firm's own legal or compliance guidance, which should always take precedence over any general practice described here.
Where reporting automation in private equity is headed
The near-term trend is consolidation around fewer tools that do more. Instead of a separate logo search, a separate chart builder, and a manual PowerPoint cleanup pass, deal teams are moving toward a single query that produces a near-finished slide, with the PowerPoint add-in, web app, and API all pulling from the same verified dataset.
API and SDK access is becoming a bigger part of that shift. Corporate strategy and private equity teams increasingly want deck-building logic embedded directly into their own internal tools and dashboards rather than treated as a separate destination, which is why REST APIs, TypeScript SDKs, and React components matter as much as the web interface itself.
The other clear direction is toward AI agents that can be queried directly for a deliverable rather than operated through a traditional interface at all. Integration points like a Model Context Protocol server point toward a future where an analyst's existing AI assistant can pull verified company data and assemble a market map without a separate manual step. For analysts, the practical upside is less time spent on data entry and formatting, and more time spent on the analysis that actually requires judgment.

What we have learned from early automation pilots
The most common mistake we see is over-customization before a single deliverable ships: teams spend a pilot's entire timeline perfecting template details instead of testing whether the core workflow saves real time. A close second is skipping governance entirely, launching automation across a whole team before anyone agrees on naming conventions or a review process.
The pilots that work best start narrow: a market map for one live deal, a logo panel for one portfolio review, a single bulk export test. Each gives a clean before-and-after comparison without disrupting a team's existing deck process.
— Quikturn Team
Getting started with Quikturn for your next pilot
We built Quikturn so a market map, comps slide, or logo panel comes from one verified query instead of an afternoon of manual searching, with the same data available through the web app, the PowerPoint add-in, or the API depending on how your team works.
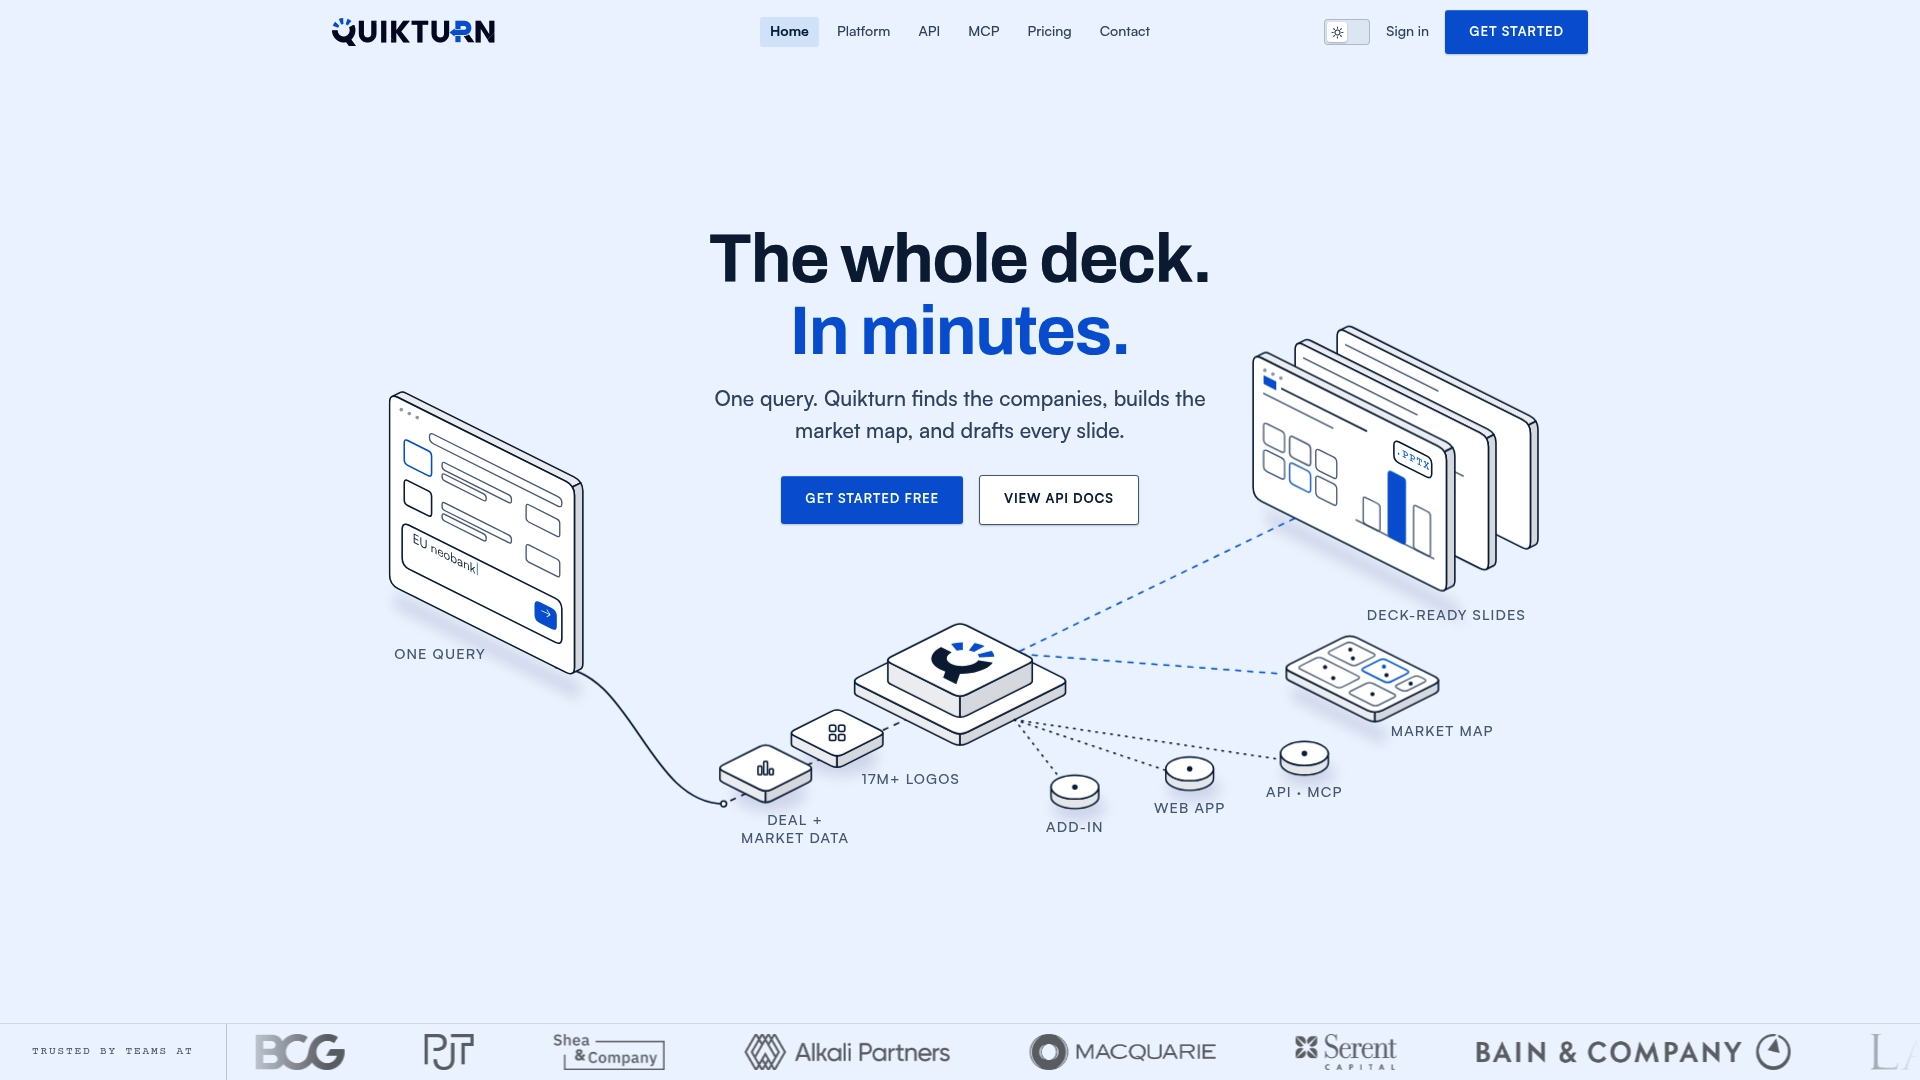
A two-week market-map pilot is a reasonable first test: pick one live deal, assign one analyst and one reviewer, and compare the finished deck against your usual turnaround time.
| Plan | Price | Best for |
|---|---|---|
| Platform Free | $0 per month | Testing core features before a pilot |
| Platform Pro | $9.99 per month or $89 per year | Individual analysts running regular deck work |
| API Launch | $45 per month or $325 per year | Teams embedding deck generation into internal tools |
Full plan details, including Enterprise options with no published price, are on our pricing page. To start a pilot directly, visit Get Started.
FAQ
What does private equity reporting automation actually generate?
It generates investor-ready deliverables such as market maps, comps slides, company profile cards, and logo panels, pulled from a verified database of company data and logos. The output lands directly in PowerPoint, a web export, or through an API call, depending on the workflow.
How long does a typical automation pilot take?
Most teams run a focused pilot over two to four weeks, producing three to five real deliverables for a live deal rather than test files. That timeline is long enough to compare turnaround time and error rates against the usual manual process.
Does automation replace manual review of investor decks?
No, a named reviewer should still sign off on every deck before it reaches an investor, checking that automated data pulls match the firm's own diligence records. Automation speeds up assembly, not the judgment calls around accuracy and sourcing.
What should we check before choosing a reporting tool?
Test data coverage and update frequency, confirm how the PowerPoint add-in handles your existing templates, and verify security features like SSO and role-based access. Pricing shape and support response times matter too, since a free tier's limits vary widely across vendors.
Is Quikturn's logo and company database verified?
Yes, Quikturn draws from a very large database of company logos and company metadata, built specifically to reduce the manual lookup and formatting errors common in investor decks. The same verified data is available through the web platform, PowerPoint add-in, and API.